Watch Your T's
Fair warning: if you are not interested in high performance NTP, then you can stop reading this blog post right now. On the other hand if you suspect your NTP servers are behaving in a temperature dependent manner then keep reading.
Temperature Stability
In a previous post I showed how heating up your server can improve its timekeeping. I started to investigate the temperature sensitivity of NTP servers to explain odd features in the timekeeping statistics. If you wonder if your servers are having similar temperature dependencies then the first thing you need to do is start logging your temperatures with the new ntplogtemp tool and charting your temperatures with ntpviz.
In the recent past NTPsec had a number of separate tools to log temperatures from different sources. Thanks to Keane Wolter we now have a single tool that searches for all your available temperature sources and logs them with one simple daemon. This program is installed by default on recent versions of NTPsec.
Temperature Sources
ntplogtemp can use up to four different types of temperature sources: /sys Zone, lm_sensors, smartctl and TEMPer. Even better ntplogtemp will try to auto detect the sources you have.
/sys Zone
If you have a CPU and run Linux then you already have the /sys Zone temperature available to you. To see your zone temperature:
# cat /sys/class/thermal/thermal_zone?/temp
33000
That shows a temperature of 33.000 °C on CPU zero. Some systems will only have one zone temperature, some have several zones.
lm_sensors
A popular UNIX package is lm_sensors. It provides access to many of the sensors in your system. Installing and configuring lm_sensors is beyond the scope of this post, but well documented elsewhere for almost every OS and hardware combination. Some systems report a lot of data, and others report none. To see your available lm_sensors readings:
# sensors
coretemp-isa-0000
Adapter: ISA adapter
Physical id 0:  +35.0°C  (high = +86.0°C, crit = +96.0°C)
Core 0:         +29.0°C  (high = +86.0°C, crit = +96.0°C)
Core 1:         +26.0°C  (high = +86.0°C, crit = +96.0°C)
Core 2:         +26.0°C  (high = +86.0°C, crit = +96.0°C)
Core 3:         +26.0°C  (high = +86.0°C, crit = +96.0°C)
That shows 5 temperatures: the CPU chip, and the four cores.
smartctl
Another popular UNIX package is smartctl. Regardless of what you do on a UNIX box you really should have smartctl installed and running all the time. smartctl monitors your HDD and SDD health and will usually warn you before any loss of data that your data drive need replacing.
For our purposes, many drives also report their temperature. I find the drive temperature is usually pretty close to the south-bridge temperature. To find out if your /dev/sda reports a temperature, simply run this:
# smartctl -A /dev/sda | fgrep 194
194 Temperature_Celsius 0x0022 029 039 000 Old_age Always - 29 (Min/Max 21/39)
You can see that the drive temperature is 29 °C.
TEMPer
The most versatile temperature sensor is also the one you are least likely to have: the TEMPer. The TEMPer is not really an exact device, but a class of USB temperature sensors from China. They all behave similarly and only need HID kernel drivers. The same, or similar, to the HID drivers that connect to your keyboard, touch-pad and mouse. Some are plastic, some metal, most are about the same size.
A quick search will find similar looking single temperature sensors from $10 to $40. Advanced models may add an external temperature probe, humidity sensor, or thermocouple interface, but they are all based on the same design and microcode. Avoid the unit with the external probe as it suffers from significant self heating.
Since the TEMPer is an HID device there are Python drivers to read the sensor(s) on most every platform. I prefer the temper-python program available here: http://github.com/padelt/temper-python.git
Once you have the TEMPer inserted into a USB port and temper-python installed it is easy to read the device temperature:
# temper-poll
Found 1 devices
Device #0: 21.1°C 69.9°F
This shows the room temperature around my server is at 21.1 °C.
All Together Now
Assuming that you have one or more of these sources installed, then ntplogtemp brings them all together:
# ntplogtemp
# time, sensor, value
1489794259 ZONE0 35.0
1489794259 LM0 34.000
1489794259 LM1 30.000
1489794259 LM2 28.000
1489794259 LM3 32.000
1489794259 LM4 27.000
1489794259 /dev/sda 29
1489794259 /dev/sdb 30
1489794259 /dev/sdc 36
1489794259 /dev/sdd 40
1489794260 TEMPER0 21.1
^C
That gives you a nice profile of temperatures in and around your system. But you probably do not want to have to run a spreadsheet by hand, so log all the data in the background then ntpviz can use it. This will log all your temperature data once every five minutes:
ntplogtemp -l /var/log/ntpstats/temps -w 300 &And you are done, or rather started. Go away for 24 hours, then come back and look at your new ntpviz data.
Results
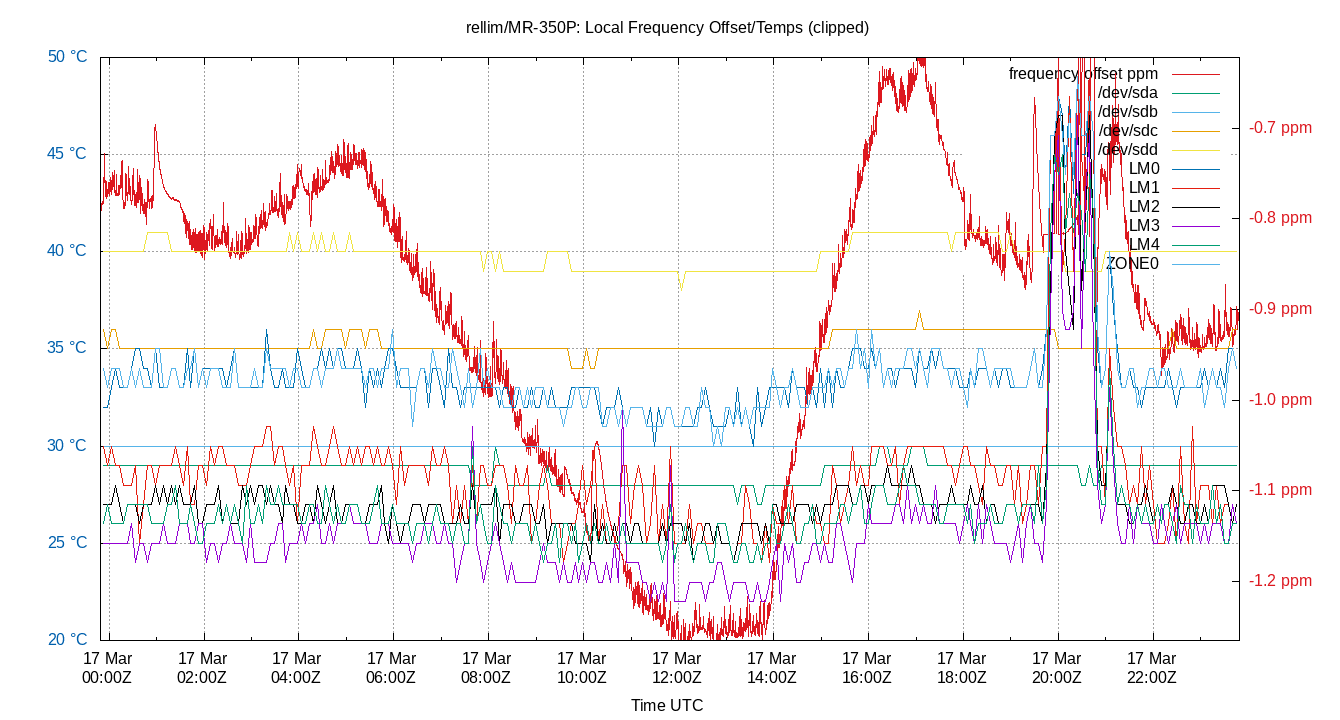
Putting it all together, we get a lot of data. In a later blog post we’ll see a good way to put it to use. Here is a look at how all those temperatures look alongside the Local Clock Frequency Offset. That offset is shown here in red and is the NTP parameter most sensitive to temperature. To my eye the offset correlates best with LM1, the temperature of CPU core zero.