
How Much Heat?
Fair warning: if you are sick of reading how temperature affects the local frequency offset, then feel free click elsewhere. For good NTP performance you merely need get the temperature of your server stabilized. For that, see previous blog posts. This blog post is about eeking out the last bit of frequency stability. It builds on the experimental setup described in the blog post More Heat.
The Staircase
Up until now, finding the best temperature to run your Raspberry Pi at has been a random walk. By request the -s option to ntpheatusb. The new option holds the desired temperature for two hours. It then steps the set point up one °C, and then holds that temperature for another 2 hours. 10 steps up, then 10 back down, and repeat.
Here is what that looks like:
The Steps
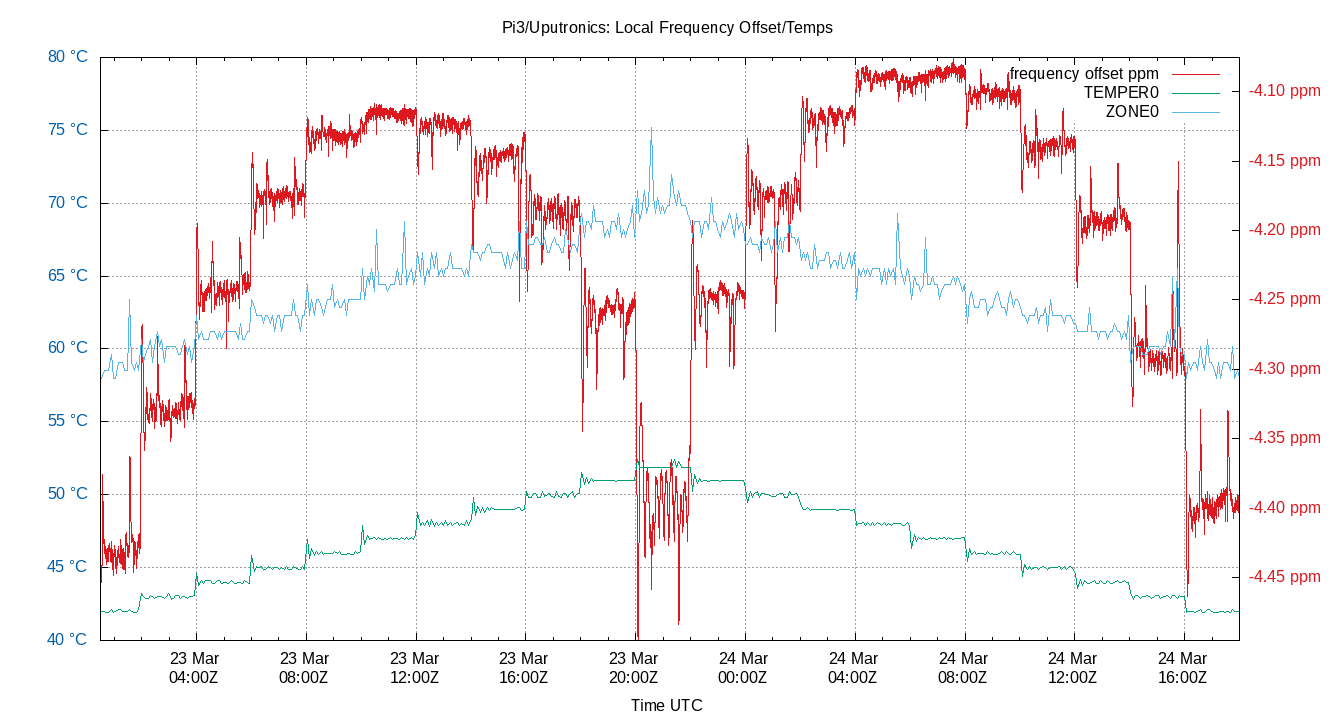
The graph only plots 3 variables: TEMPER0; ZONE0 and Frequency Offset. I’ll describe each one at a time.
TEMPER0
TEMPER0 is the temperature in the test box and is drawn in dark green. The output of TEMPER0 shows the temperature that ntpheatusb is creating. It starts at 42 °C, steps up to 52 °C, then back down to 42 °C. Each step lasts 2 hours.
You’ll notice that the leading edge of every step has an overshoot, followed by a few cycles of ringing. This is usually considered the fastest and ideal way for a pulse to change from one stable value to another.
ZONE0
ZONE0 is the temperature inside the CPU chip and is drawn in light blue. It starts at about 58 °C on the left, rises to about 70 °C in the middle and them back down to about 58 °C. It looks more like a ramp up and down than a staircase, so the CPU is taking about two hours to adjust to the changing ambient temperature.
There are also small spikes in the ZONE0 temperature. The spikes happen when cron jobs fire of and load up the CPU.
Frequency Offset
The red line is the Local Frequency Offset as computed by NTP. Ideally this would be a horizontal line, but in the real world crystal oscillators are temperature dependent.
The trace starts at the left at about -4.43 ppm. It increases to about -4.12 ppm when the rising stair step is at 47 °C, then decreases back to about -4.40 ppm at maximum temperature. The second half of the red trace mirrors the first half, except it is shifted slightly upwards. This shows that zero TC is close to 47 °C.
There are some interesting characteristics to the frequency graph. The small overshoot in the TEMPER0 steps leads to large overshoots in the frequency. This is expected as NTP controls the frequency with a PLL, and this is how a PLL reacts to sharp changes in input.
At temperatures lower than zero TC, load spikes show up as an increase in frequency offset. When the temperature is higher than zero the temperature spikes are in the downward direction. This means you can quickly guess if your crystal is above or below zero TC by the direction of the load spikes.
The most important thing to note about the frequency offset near zero TC is how stable it is. NTP is all about stability.
Local Time Offset
Does this really affect how well your NTP server can keep time? Not by much as this graph shows:
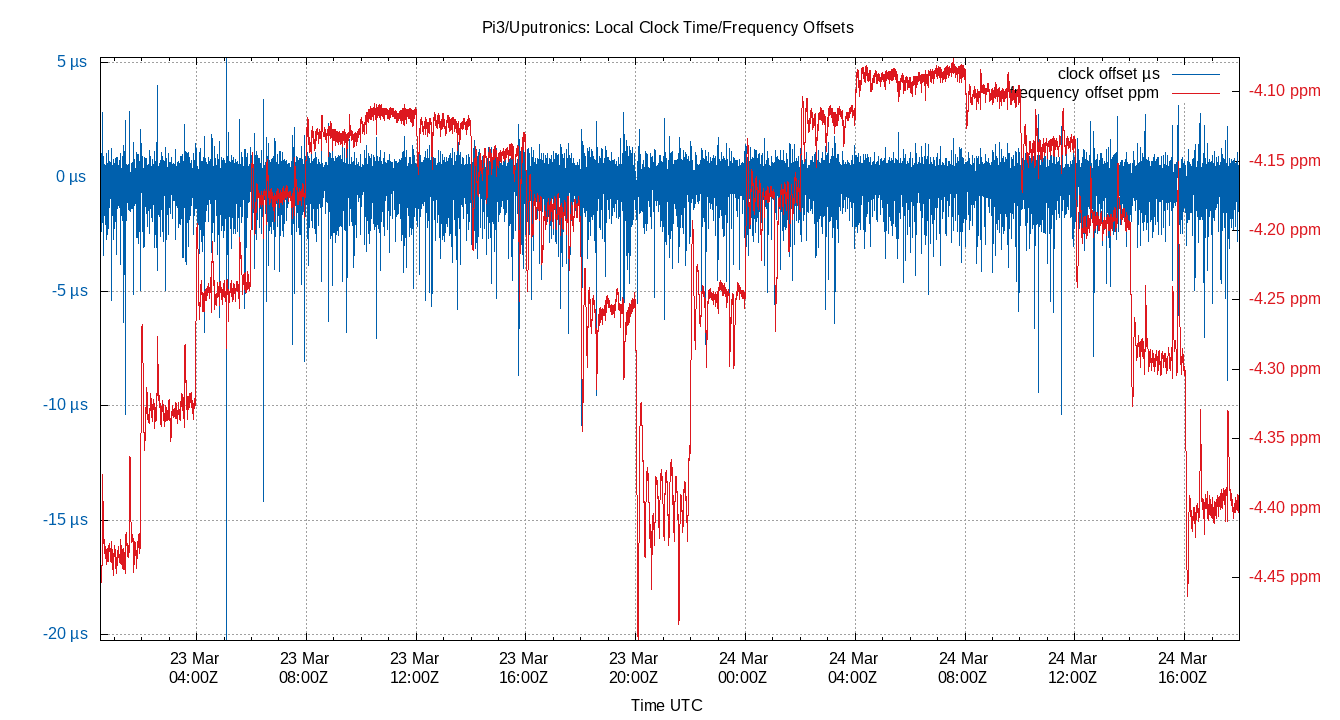
The blue line is the Local Clock Offset, an important measure of how well your NTP server is tracking time. The offset jitter at the zero TC point is only slightly lower than when the ambient temperature is ±5 °C.
Putting it All Together
Two hour steps seem to be barely long enough to narrow down the zero TC point. Two hours is clearly not long enough for the entire system to stabilize. This reinforces the idea that is probably best to run your ntpd for 12 or 24 hours after making any change before bothering to gather any statistics.
What does it all mean to the casual NTP server admin? Stabilize the temperature around your NTP server. Better yet find your zero TC and try to operate somewhat close to that point. But do not worry about getting the temperature exactly right, it will not noticeably improve your time service.