
Watch That GPS
Fair warning: if you just do not use, or plan to use, a GPS with NTPsec, then you can stop reading this blog post right now. If you do use a GPS refclock you are probably getting ready to skip to something else, but don’t do it.
Conventional Wisdom
Conventional wisdom about using a GPS with NTP has been simple. Set your GPS antenna in a static location with at least a fair sky view, check that it has a few GPS satellites in sight, configure ntpd to use the GPS as a refclock, and then forget.
No need for an internet connection, backup chimers or any secondary sources. Well, if unknown uptime is good enough for you then that is OK. But if you need quantified uptime, then you need to do better.
Measure It
Before you believe the time to your GPS, you should really watch how it works for a day. Preferably you should monitor it all the time. The NTP drivers give you almost no visibility on how your GPS is working. To see how your GPS is doing you need to be running gpsd to get PPS time to your ntpd. Then NTPsec makes the watching easy with ntploggps and ntpviz. Just tell ntploggps to place its logs in your NTP statistics directory. Then ntpviz will automatically use the new data.
# ntploggps -l /var/log/ntpstats/gpsd &Visualize It
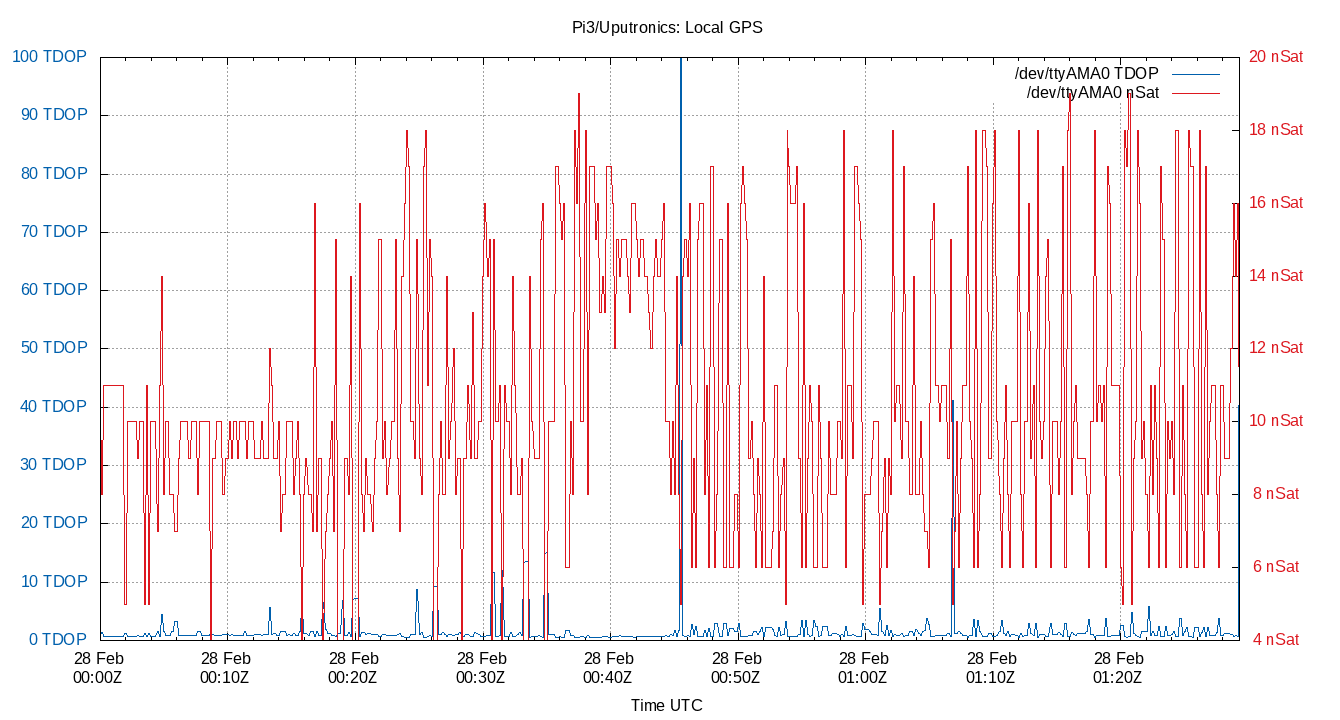
I used to think my GPS always had a stable lock. The few times I checked it always seemed so. Plots like the one below opened some eyes. The scale on the right is the number of satellites in view. the scale on the left is the Time Dilution of Precision (TDOP). TDOP is a goodness ratio telling how well the GPS is keeping time relative to its data sheet claims. A value of one or less means the GPS is working as expected, or better. A TDOP of 20 means it is performing much, much, worse.
You’ll notice that on average, the subject GPS is using 10 satellites to calculate the PVT solution. Sometimes up to 18. Looks good, right? That is confirmed by a TDOP of 0.89 or better 50% of the time. But notice the TDOP is worse than 13.6 for 1% of the time, sometimes as bad as 99.99! In the 90 minutes of the plot there were zero satellites in use 11 times.
| Min | 1% | 5% | 50% | 95% | 99% | Max | |
|---|---|---|---|---|---|---|---|
nSats |
4.000 |
4.000 |
5.000 |
10.000 |
17.000 |
18.000 |
19.000 |
TDOP |
0.450 |
0.540 |
0.600 |
0.890 |
3.700 |
13.620 |
99.990 |
| 90% | 95% | StdDev | Mean | Units | |
|---|---|---|---|---|---|
nSats |
12.000 |
14.000 |
3.692 |
10.523 |
nSat |
TDOP |
3.100 |
13.080 |
5.490 |
1.768 |
Conclusion
You are likely now wondering why I don’t have a matching plot showing some loss of time precision. Luckily I don’t have any plots like that. I suspect that is for two reasons. First, the TXCO in the Uputronics GPS is coasting thorough the small outages. Second, gpsd and ntpd together have good PPS input filtering.
The motivation for *ntploggps* was a solar storm last winter. I heard reports from others of GPS signal loss, and when checking my logs I discovered my GPS’s had experienced similar outages. Next time I’ll have a pretty graph of it.
During the outages my NTP servers fell back from GPS to other time sources. If you depend on your time, be sure to have backup chimers.
References
link:https://en.wikipedia.org/wiki/Dilution_of_precision_(navigation)