
Seeing through the numbers
Ask two different people how accurate their NTP servers are, and you will get at least four different answers. Ask three different people the effect of changing a setting in ntp.conf, and you will get at least six different answers.
"If you can’t measure it, you can’t improve it." - Lord Kelvin
NTP has long had log files containing lots of measurements about the functioning of the NTP daemon, but there was no methodology to analyze or visualize that data using basic statistical principles.
This is changed by ntpviz. A sysadmin can now unambiguously assess the short and long term performance of his NTP. This allows the sysadmin to run tests of varying configurations and quantify the effects the changes make. Best of all, once installed, ntpviz runs totally unattended, making sure the data is predigested when someone wants to see it.
This post will help the reader to install, and run, a basic ntpviz setup. Later posts will explore more aspects of ntpviz and what it tells us.
Installation
NTPsec is under active development, and few distros ship NTPsec packages yet. So for now just get a copy of the latest source and install it. Here is how I do it:
# get root
su -
# make a place for the code
mkdir -p /usr/local/src/NTP/
cd /usr/local/src/NTP/
# get the code
git clone --depth 1 https://gitlab.com/NTPsec/ntpsec.git
# build the code and install the result
cd ntpsec
./waf configure --refclock=all && ./waf build  && ./waf install
# install a sample config file
cp contrib/ntp.conf.log.sample /etc/ntp.conf
Easy. You now have NTPsec, and a basic ntp.conf installed. Be careful, your distribution may overwrite your new /etc/ntp.conf file. You can find more detailed installation instructions, and dependency information, in the INSTALL file located in the project top level source code directory.
Running
Of course nothing happens until you have ntpd running, and logging data. Double check that your ntp.conf has statistics logging turned on and start up ntpd.
# get root
su -
# be sure no other ntpd is running
killall ntpd
# start the new ntpd
ntpd -N
# watch the magic happen
ntpmon
If that all worked then you should be watching ntpd slowly pull your system clock to the correct time. While you watch that, now is a good time to review the INSTALL file for tweaks you may be interested in, or to resolve any issues that just arose.
Once you are happy with the running ntpd, take some time to figure out how your distro likes to manage daemons. This is much too system specific to discuss here.
Time Out
You now have ntpd doing what it does best, keeping your local clock accurate. You are eager to see how well your system is running by using ntpviz. Well, not so fast, pilgrim. You do not have any data in your logs to analyze. Take a break, consume some of your favorite beverage, enjoy a good night’s rest, ponder the universe, and come back here in not less than 24 hours. At that time you’ll have some data.
24 Hours Later…
24 hours over, already? Time to have ntpviz grind your data. This will take about 10 seconds:
# get root
su -
# change to the output directory
cd /usr/local/src/NTP/ntpsec/www
# make the pretty graphs for last 24 hours of data
ntpviz @day/optionfile
# if you have a week of data, analyze that.
ntpviz @week/optionfile
All of your time data is now summarized in these two csv files:
day/summary.csv
week/summary.csv
Oh, snap. You were expecting pretty graphs? Well then one additional step:
firefox file://localhost/usr/local/src/NTP/ntpsec/www/day/index.html
So Much Data
Yes, that is a lot of graphs and data. Luckily each graph has a statistical summary below it, and a short description of what is being plotted. At the bottom of the page you will find definitions of all the terms used.
For those of you cheating and not running your own copy of ntpviz, here is one of the many graphs:
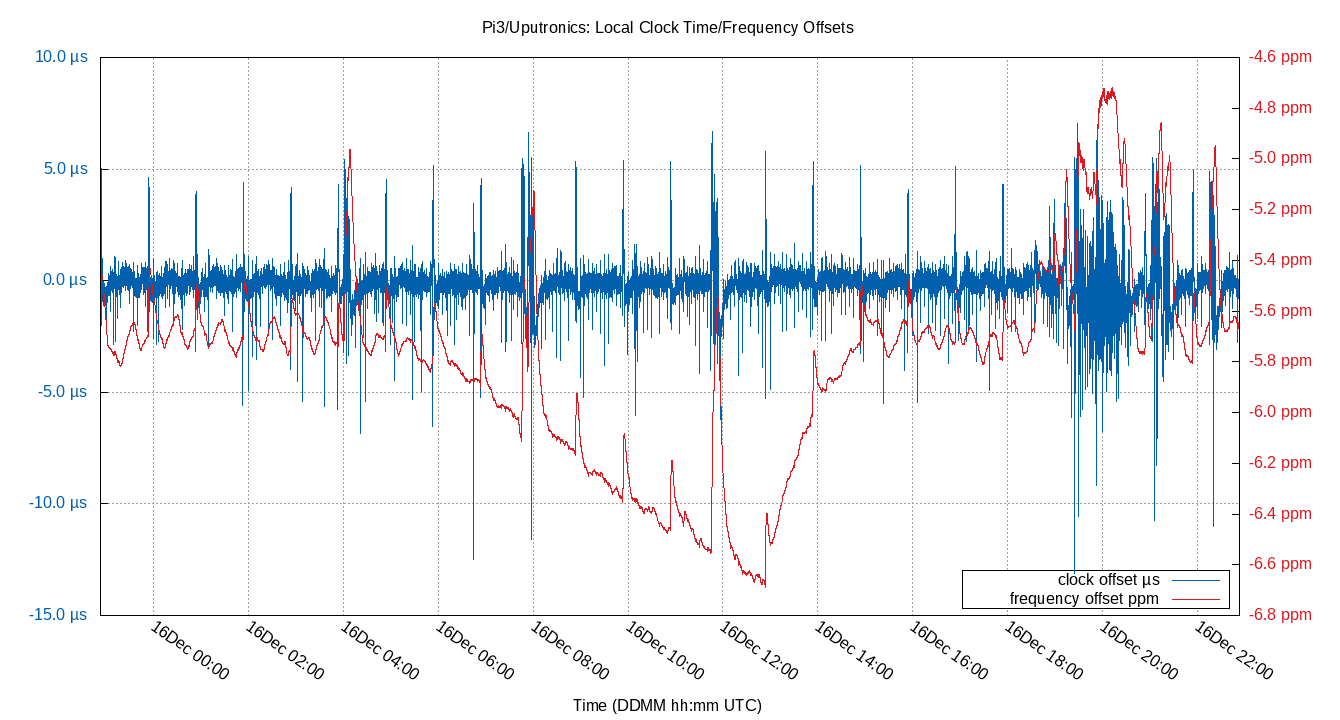
The blue line is how accurate ntpd thinks the local clock is. The red line is how much ntpd has to push the local clock to keep time accurate. Look more carefully at the red line. The little jiggles on the left correlate to the room heater cycling on and off. The big drop in the middle occurs when the heat goes off for the night, followed by a big rise when the heat comes on in the morning.
The big spikes in the red and blue lines happened when the CPU was busy. The extra heat from the CPU coupled to the on board clock crystal and shifted the crystal’s resonant frequency. In later posts I’ll go into more detail on each of these graphs and show how to add temperature plots.
The data is summarized at the bottom of each graph. The local offset summary to match the above graph is:
Percentiles......
Min	1% 	5%	50% 	95%	99% 	Max
-13.135	-2.305	-1.127	-0.054 	1.453	1.453	7.035

Ranges......
90%	98% 	StdDev
2.580	5.977	0.912

Mean	Units
-0.003	µs
The first part lists the percentiles. 5% of the samples were below -1.127 µs.
The second parts lists the ranges. 90% of the data was within a range of 2.580 µs.
The final part shows the arithmetic mean was -0.003 µs.
If you want to play with the summaries in a spreadsheet you can find all that data in the summary.csv file.
Sharing is caring
You will quickly tire of running ntpviz every hour just to see your data. Automate that by adding these lines to your crontab:
49 * * * * cd /usr/local/src/NTP/ntpsec/www; ntpviz @day/optionfile
6 0-23/3 * * * cd /usr/local/src/NTP/ntpsec/www; ntpviz @week/optionfile
The easiest way to share your data is to run a web server on your ntp server. I find that nginx runs fine even on a Raspberry Pi Version 1. Your distribution should have detailed instructions on how to install nginx. Once installed, just point the server root to the directory with the ntpviz output files. Like so:
cat /etc/nginx/nginx.conf
[...]
    server {
	root /usr/local/src/NTP/ntpsec/www;
[...]
Some people consider sharing ntpviz output to be a security risk. If you feel that way, then be sure to password protect the server.
Next…
That was easy, wasn’t it?
Future posts will explore many topics:
-
What different graphs are telling us
-
How to log and graph supplemental data
-
How to customize the reports
-
Typical data for various ntpd servers
-
The results of some interesting experiments
Until then, enjoy your data. Share what you discover.